Are you looking for the information about ElasticSearch? What is purpose using Elasticsearch in Informatica MDM? If yes, then this article provides you with detailed information about it. This article also highlights on brief history about Elastic Search.
What is Elasticsearch?
Elasticsearch is an open source, a distributed, multitenant-capable full-text search engine developed in Java. It is founded in 2012 to provide a scalable search solution. It comes as ELK stack i.e. Elasticsearch, Logstash and Kibana. These three products together provide great search solution. Elasticsearch is a search engine based on Lucene. Logstash is a repository where actual logs(Information/data) is stored and send to Elasticsearch. Kibana is a user interface where logs are shown in an analytical form such as graph etc.
Informatica MDM and Elasticsearch
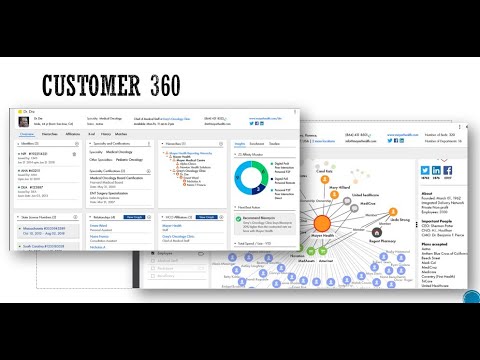
Elastic search is integrated with Informatica MDM from MDM version 10.3 for better search functionality in Customer 360 application. Once the Elasticsearch in MDM, the search functionality can be viewed in Customer 360 application as below -
Elasticsearch and Solr Search in Informatica MDM
We can use either Solr or Elasticsearch with Informatica MDM. Both search engines are based on Lucene library. However, Elasticsearch is better in performance. Search with Solr is deprecated and is replaced by the search with Elasticsearch.
With Elasticsearch, we can use the asterisk wildcard character (*) to perform a search.
The query parser of Elasticsearch provides the flexibility to use various types of characters in the search strings.
Solr search does not provide the flexibility to use various types of characters
With Elasticsearch we can use operators such as AND and OR to search for records.
How to install Elasticsearch?
Elasticsearch package comes with Informatica MDM 10.3. The installation instructions are simple and provided in the installation guide. You can install Elasticsearch on any machine where the MDM Hub components are installed or on a separate machine. However, if you would like to install it as standalone then you can install Elasticsearch from here. DOWNLOAD
You can refer the video below to configure Elastic search with Informatica MDM
Are you looking for an article on how to monitor IDD users? Are you also looking for information what changes need to be made in order to achieve it? If yes, then refer this article. This article explains what is need of user monitoring and how to configure it.
Introduction
The Informatica Data Director (IDD) is one of the business critical application. The various business users uses IDD application. It is always good idea to monitor users using the application for security reason. In lower environments such as development or QA, it become more tedious to track who made the change. So having monitory control on login mechanism will try to avoid such incidents. This articles helps to configure IDD application for monitoring users who uses it.
Configuration file
We need to use log4j.xml file to log users which uses IDD application. We can use existing log file or can create new log file.
File Location
We need to update log4j.xml file from below location
<install directory>\hub\server\conf
Code Changes
Add the code below after consoleappender code in the log4j.xml file
Normally application server restart is not required. However, if log file is not generated after above code changes then restart the application server.
How to analyze the log file
If user is logged in or logged out then this information will be stored in the log file. The log file entry will look like as below :
[2018-09-25 15:03:31,774] [http-/0.0.0.0:8080-5] [INFO ] com.siperian.dsapp.common.util.LoginLogger: User <admin> logged into IDD
[2018-09-25 15:04:14,255] [http-/0.0.0.0:8080-2] [INFO ] com.siperian.dsapp.common.util.LoginLogger: User <admin> has been logged out of the IDD"
[2018-09-25 15:04:14,329] [http-/0.0.0.0:8080-2] [INFO ] com.siperian.dsapp.common.util.LoginLogger: User <testuser> logged into IDD
[2018-09-25 15:05:16,295] [http-/0.0.0.0:8080-5] [INFO ] com.siperian.dsapp.common.util.LoginLogger: User <testuser> has been logged out of the IDD"
[2018-09-25 15:05:16,295] [http-/0.0.0.0:8080-5] [INFO ] com.siperian.dsapp.common.util.LoginLogger: User <admin> has been logged out of the IDD"
[2018-09-25 15:05:23,309] [http-/0.0.0.0:8080-6] [INFO ] com.siperian.dsapp.common.util.LoginLogger: User <jamesmanager> logged into IDD
[2018-09-25 15:06:32,365] [http-/0.0.0.0:8080-7] [INFO ] com.siperian.dsapp.common.util.LoginLogger: User <jamesmanager> has been logged out of the IDD"
The video below provides additional information about how to monitor users which are logged in the IDD Application.
Q1. Match rule sets include which of the following
A. A search level that dictates the search strategy
B. Any number of automatic and manual match column rules
C. A filter to selectively include or exclude records from tha match batch
D. Match path for inter-table/Intra-table-matching
Q2. Which correctly describes master data??
A. Customer name
B. Customer address
C. Customer purchases
D. Customer preferences
Q3. A role is a set of privileges to access secure informatica MDM hub resources
A. True
B. False
Q4. Which statement best describes what the build match group(BMG) process does
A. Allows only a single "null to non-null" match into any group
B. Removes redundant matching
C. Executes in advance of the consolidate process
D. All statements are correct
Q5. What happens to records in the stage process that have structural integrity issues?
A. They are written to reject tables.
B. They are placed in the manager merge process
C. They are written to the raw table
D. They are added to the enhanced filtering process for resolution.
Previous QuizNext Quiz
Q1. Which of these features are supported in Metadata manager?
A. The renaming of certain design objects.
B. Promoting record states.
C. Running a simulation of applying a change List.
D. Validate repository.
Q2. After configuration of the hub store which batch jobs are created automatically?
A. External Match jobs
B. Revalidate Jobs
C. Promote jobs
D. Synchronize jobs
Q3. When grand children are displyaed in table, view all grand children are deplayed not just those related to the selected child.
A. True
B. False
Q4. What does the trust frameWork do dynamically?
A. Defines whether two records will match
B. Maintains cell-level survivor ship of only the best attributes
C. Calculates a data quality score to be used on a data score card.
D. Standardizes data to make its most trustworthy form.
Q5. Which of the following is NOT an advantage of the MDM hub?
A. Can run in any database and version.
B. Flexibility to use any data model that is appropriate for a given customer.
C. A consistent design and architecture built on a single code base.
D. The ability to handle any data domain.
Do you know how Hard Delete Detection (HDD) works in Informatica MDM? Are you interested in knowing the basic concepts and the working principles of HDD? Are you looking for a sample code of HDD? If so, then you can refer to this article. In this article we will discuss the Hard Delete Detection process and its usage in the Informatica MDM.
What is the Hard Delete Detection?
Hard Delete detection is abbreviated as HDD. It is a process to determine the records removed or physically deleted from the source system. Informatica MDM determines the records which are removed from the source system and soft delete it in the associated MDM base object tables.
What are the soft delete and the hard delete?
Soft delete and hard delete are not Informatica MDM concepts. These are well known concepts for any database management system. Soft deletion is achieved by using a column such as 'STATUS' or 'ACTIVE_INACTIVE' or any other column which tells the record is deleted or active for business. So soft deleted records are physically maintained in the database but are not active for business purposes. The soft deleted records can be recovered by making them active and making them available them for business.
On the other hand the hard deleted records are physically removed from the database and those are not available to business once those are hard deleted.
Do all types of databases support HDD in Informatica?
No. Only Oracle and Microsoft SQL Server environments can detect records that are removed from the source systems. The DB2 database environment cannot detect records which are removed from the source systems.
How HDD works in the Informatica MDM?
The stage job in the MDM Hub compares all the records in the landing with the records in the previous landing table (aka PRL table) associated with each landing table.
After determining the missing records in the landing table those are flagged as hard deletes for a full load.
The hard delete flagged records are reinserted back into the landing table along with a delete flag value.
For flagging records for hard deletes in the source, either we can use HUB_STATE_IND column or any other custom column.
After running the stage and the load job in the MDM Hub, records are updated in the associated base object table.
What are the requirements for HDD implemenation?
Below are major requirements for implementing HDD :
In order for HDD to work, we need to have a full load every time. It does not work with incremental or transitional loads.
We need to create a hard delete detection table in the repository table to configure hard deletes.
In order to make entry into the job metric table, we need to maintain an additional configuration.
HDD requires user exits to be written in Java.
What are the User Exits required for HDD implementation?
Below are the user exits required to be implemented for HDD:
1. Post Landing User Exits
2. Post Stage User Exits
Sample code for User Exits:
Here is a sample code for Post Landing User Exits:
public class PostLandingUE implements PostLandingUserExit {
public void processUserExit(UserExitContext oUEContext, String stagingTableName, String landingTableName,
String PRLTableName) throws Exception {
try {
HardDeleteDetection hdd = new HardDeleteDetection(oUEContext.getBatchJobRowid(), stagingTableName);
Are you looking for details about 'grep' commands in the Unix environment? Are you also looking for what are structures and samples for various 'grep' commands in the Unix system? If so, then this article provides detailed information about 'grep' command with its usage.
What is the 'grep' command?
The word grep stands for globally search a regular expression and print. The command 'grep' is a command-line utility. It is used for searching plain-text data. The search is performed by using a regular expression.
Commands:
1. Use the command below to search a specific string in the specified file grep "Techno Guru" test_file
2. Use the command below to search a specific string in all the files grep "Techno Guru" *
3. Use the command below to search a specific string in only in the .log files. We can also use regular expressions such as abc*.log, *test*.*, abc*.log. Search will be performed against files which matches this file patterns. grep "Techno Guru" *.log
4. Use the command below to perform case in-sensitive search. The command below will matches all the words such as "TECHNO GURU", "Techno Guru", "tEchno Guru", "techno guru" etc. grep -i "Techno Guru" test_file
5. To print the matched line, along with 5 lines after it. grep -A 5 -i "Techno Guru" test_file
6. To perform recursive search grep -r "Techno Guru" test_file
7. To perform recursive search in all the files. Below command searches "Techno Guru" word in all the files under the current directory and its sub directory grep -r "Techno Guru" *
8. Use the command below to search using regular expression in search string. The command below searches for starting string "Techno" and ends with "Guru". You can use other different search pattern as well. grep "Techno*Guru" test_file
9. What are the regular patterns can be used?
The below mentioned regular patterns can be used while working with grep command.
? : Matched at most once.
* : Matched zero or more times.
+ : Matched one or more times.
{n} : Matched exactly n times.
{n,} : Matched n or more times.
{,m} : Matched at most m times.
{n,m} : Matched at least n times, but not more than m times.
10. Use 'grep -w' command to search for full words and not for sub-strings. In the below command exact "Techno" or "techno" or "TECHNO" will be matched in the file. However if file contains "Technoworld" then it will not be identified as match. grep -iw "Techno" test_file
11. Displaying lines before/after/around the match using grep -A, -B and -C
If you are performing file analysis in real time project, it will be useful to see some lines after or before the match.
a) To display 5 lines after match grep -A 5 -i "Techno Guru" test_file
b) To display 5 lines before match grep -B 5 "Techno Guru" test_file
c) To display 4 lines around match. The option -C used for the match to be appeared with the lines from both the side. grep -C 4 "Techno Guru" test_file
12. To count the number of matches use the command below grep -c "Technology World" Test_file
13. To count the number lines which does NOT found match, use the command below grep -v -c "Technology World" Test_file
14. To highlight the search. In order to see which part matches the line, we can highlight it as (Use can use any color to highlight) export GREP_OPTIONS='--color=auto' GREP_COLOR='99;8'
15. To determine the name of files in which match string found. grep -l "Techno" test_*
16. Use the command below to show only matched string as by default grep command shows the line which matches the given string. grep -o "Techno Guru" Test_file
Are you looking for an article about how to install weblogic server? If so, then refer this article as it provides detailed step by step instructions about how to install weblogic server. In this article, we are going to see steps for installing weblogic server with version 10.3.6.
Step 1: Download weblogic server installer from Oracle website. If you downloaded on the Windows system then it will be .exe file. The first thing we need to create Weblogic server installation is the 'Domain. Double click on .exe file to launch it. You will get below dialog window where you need to provide domain name and location of domain. Provide these details and click on 'Next' button.
Step 2: We need to create administrator user to perform administrator activities on weblogic server. To create admin user provide user name and password and optional description in the dialog window as shown in below screen shot and click on 'Next' button.
Step 3: Based on environment we need to choose Development Mode or Production Mode. Choose option appropriately. You can either select available JDK or Other JDK which is installed in your system. I would recommend to use the 'Other JDK' option as it will be for maintainability perspective. After selecting JDK option click on 'Next' button.
Step 4: Select all the components which are required for your environment. Based on these selections the next screen will change. In our current selection we are choosing 'Administration Server', 'Managed Servers, Clusters and Machines' and 'Deployments and Services' options. If you need JMS configuration also then choose option accordingly and then click the 'Next' button.
Step 5: In the next dialog box we need to provide the details about Administration Server, such as Administration Server Name, Listen port, SSL port etc. Once all these details are provided then click on the 'Next' button.
Step 6: After providing admin server details, next screen will ask us to provide managed server details. Provide the managed server name, hosting server, listening port and SSL port if SSL is enabled. Once all these details are provided then click on 'Next' button.
Step 7: In this step we need to configure cluster if your project requires cluster to be configured for better application availability and performance. Click the 'Next' button on this screen.
Step 8: In the next step assign servers to clusters. Once servers are assigned to cluster click on the 'Next' button.
Step 9: We need to create machine on which servers will be running. So configure machine name and listen address and listen port. Once these details are provided click on the 'Next' button.
Step 10: In this step assign Admin Server and Manged servers to machine. Once assignment is done click on the 'Next' button.
Step 11: Assign JMS Services, Work manager and any other services to clusters or servers which are configured in earlier steps. Click on the 'Next' button.
Step 12: We will see summary of Weblogic server configuration in the next screen. Click on the 'Create' button.
Step 13: In this screen, we can see progress of Weblogic server installation and components which are getting installed. Once 100% installation is done then click on the 'Done' button.
With these steps, Weblogic server is ready for use. You can refer the video below to learn more about Weblogic server.